Analysis of NIST BEs
Statistical Analysis and Uncertainties in NIST BEs |
||
| Menu-Link | ||
 |
Histogram Plots
for all the Elements and Various Common Chemical Compounds is available at:
“Histogram Plots of NIST BEs”
Problems in NIST SRD-20 XPS Data-bank v1.0 – v4.1
This data-bank suffers from most, if not all, of the systematic and random errors that trouble many old sources of BE numbers. This occurs because the database incorporated data measured by using different calibration energies, different charge referencing values for the C 1s hydrocarbon moiety, various charge control methods and various analysis conditions on many different instruments. The degree of these problems is partially revealed by the data shown in the Periodic Table.
Each data-file in the NIST numerical data-bank includes a category called “Energy Uncertainty”. A random review of 50 files revealed that only half of the files had an Energy Uncertainty value, and there is no indication as to whether the value is the total range or half of the range of uncertainty.
Under the category called “Energy Scale Evaluation”, the system uses the term “Reliable”. The definition, as it is written, i.e. “…within 300 eV of a reference point on the energy scale…” suggests that any BE outside of that 300 eV span should be suspect and may have a large degree of uncertainty especially since most of the measured BEs are referenced to low calibration energies for Ag 3d5/2 (~368 eV) and Au 4f7/2 (~84 eV). Therefore, BEs above 700 eV are more uncertain.
Under the definition for “Energy Scale Evaluation”, the sentence begins with: “Literature data will not ordinarily be included unless correspondence with at least one point on this energy scale can be determined…” The indirect double negative wording reveals that some data will be included even if it does not have “…at least one point on this energy scale “.
The “General Information” category in this database is said to report the “overall energy resolution”. A random review of 30 data-files for pure elements gave a null result. And, regrettably, the definitions on the “Data Field Definitions” page do not include a definition of “overall energy resolution”.
Another random review of 30 data-files from conductors and insulators indicates that authors seldom report more than one calibration energy and they reported either the Au 4f7/2 or C 1s BE as the sole source of energy calibration. This tendency, if pervasive, greatly increases the uncertainty in BEs greater than 285 eV, the BE for C 1s.
Under the “Charge Reference” category, the database reports that gold (Au) deposition is accepted as a method for charge referencing insulators. Unfortunately, work reported by Kohiki shows that the use of gold (Au) decoration for charge referencing is not reliable since data derived from this method of charge referencing was found to produce a large degree of uncertainty.
A literature source that defines the justification for using C 1s BE = 284.8 eV for the adventitious hydrocarbon moiety is not provided even though it is used to charge reference thousands of BEs from non-conductive materials. Any government institute for standards (e.g. NIST) should provide a series of references to significant literature work that justifies the use of this value, along with an appropriate uncertainty value. Unfortunately, this sort of supporting documentation is missing.
The NIST use of the term “adventitious hydrocarbon” implies the presence of a chemical compound that is a pure hydrocarbon. Based on this author’s experience, “adventitious carbon” materials are always accompanied by an oxygen-bearing component. A more correct phrase is “adventitious hydrocarbon moieties or components” which better reflects the true nature of “adventitious carbon”.
Version 4.1 of the NIST database provides a list of “Elemental Referenced Data” including a category called “Recommended binding energies for principal photoelectron lines (85 elements)”. These recommended BEs were compared to the mean BEs derived from the BEs of all available pure element BEs listed in v3.4 – v4.1 of the SRD-20 NIST XPS Database. Approximately 40% of the difference values shown in the chart are ≥0.15 eV, which is significantly larger (7X) than the ≤0.02 eV uncertainty attributed to the calibrant BEs listed in the Method of Energy-Scale Calibration.

Chart showing differences between “Recommended BEs” and “Mean BEs Derived from NIST SRD-20 Database” for pure metals. Derived from analyzing v3.4 of NIST SRD-20.
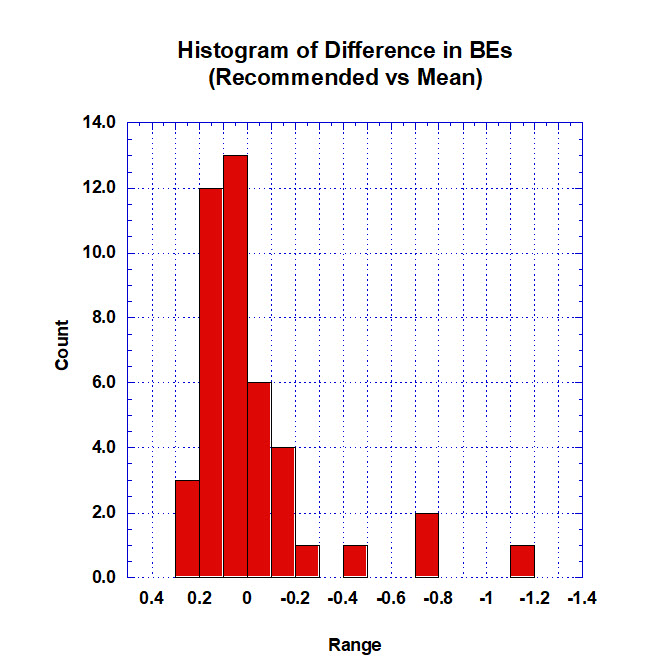
Histogram showing differences between “Recommended BEs” and “Mean BEs Derived from NIST SRD-20 Database” for pure metals. Derived from analyzing v3.4 of NIST SRD-20.
Based on this fact, it is difficult to understand how to use the BEs of pure conductive elements provided in the NIST SRD-20 XPS database.
A publication by Dr. Powell (NIST) reports a detailed comparison of the BEs of pure elements originally published by JEOL, PHI, Crist and Martensson that provides extensive inter-comparisons of those BEs and a mean BE derived from those BEs. The comparison produced mean differences of 0.02 and a standard deviation of 0.06. Based on the number of professional contributors, this result would make a useful addition to the Recommended BEs section.
Despite the problems and missing features, this dedicated numerical data-bank is useful as a guide for making chemical state assignments.
If statistical analyses or histogram plots that indicate which BE is “most” accurate or most likely, were included then the usefulness of the BEs in this data-bank would be clear. Otherwise, the user of this data-bank needs to be cautious.
This website includes a collection of Histogram Plots from the BEs listed in the NIST Database.
Examples of Histogram Plots


